Mapping Value Flows

A Danish towage provider wanted to understand what drives value for their global customers. The answer pointed upstream of the invoice.
Industry
Maritime
Team
3 people
Duration
4 months
My role
Strategic designer in a small team (two strategic designers, a data analyst and a visual designer).
Reframed the brief, defined project goals, scope, and strategic direction
Led research, synthesis, and translation of insights into actionable recommendations
Developed frameworks and recommendations based on research insights
Designed and facilitated workshops to align stakeholders, test assumptions, and shape direction
Designed and structured experiments to validate key assumptions behind strategic opportunities.
THE BRIEFIdentifying customer-driven value opportunities for growth
The client sought an outside-in view of their product offerings through the lens of customer value, based on the hypothesis that customer centricity is a key differentiator.
The brief — analyse current offerings and identify what drives value for direct and indirect customers to inform go-to-market strategy and uncover future growth opportunities.
UNDERSTANDING THE BUSINESSChoosing where to look
Before assessing growth opportunities, we first needed to understand the business and the ecosystem in which it operates.
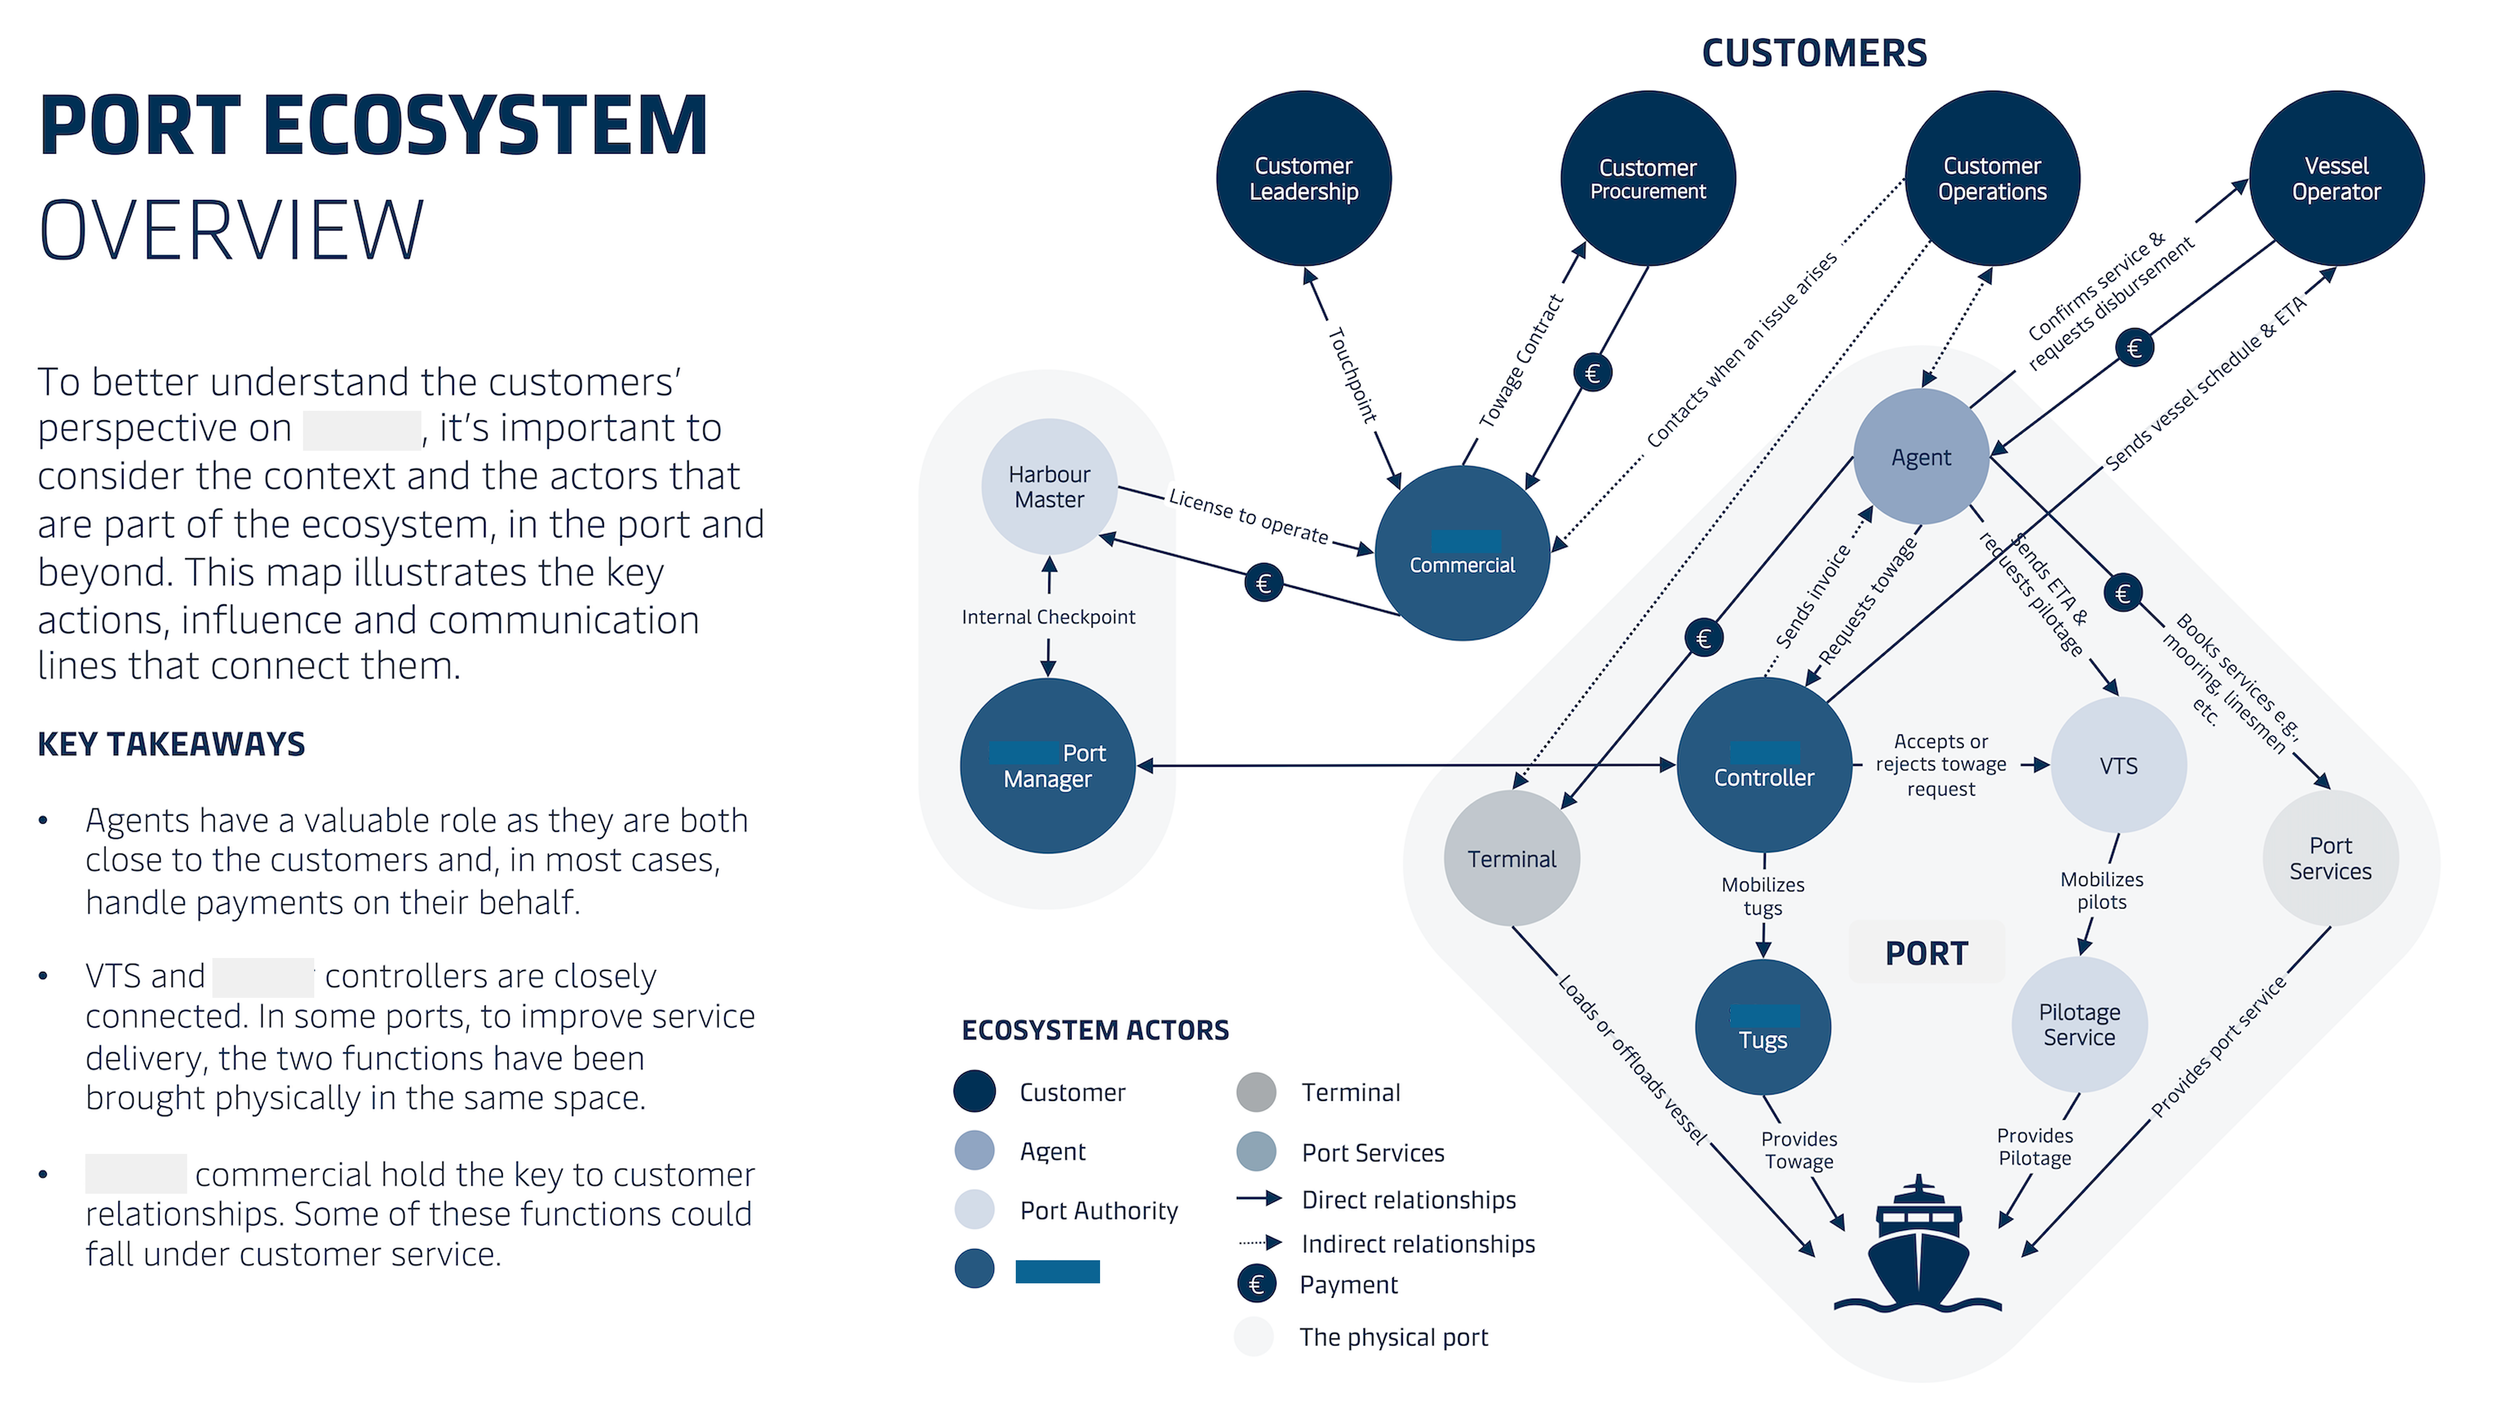
We mapped the port ecosystem to identify the actors involved, how they connect, and where the client creates value. Alongside this, we interviewed stakeholders across the organisation and within the ports, revealing both how the business saw itself and how customers experienced it.
Comparing these perspectives surfaced several assumptions about what drives value, loyalty, and competitive advantage. Some reflected deliberate strategic choices; others had become embedded in everyday ways of working. Rather than treating them as facts, we used them as lenses for further investigation.
In my experience, where a business invests its effort is often a proxy for what it believes creates value. Testing those beliefs early matters because misaligned assumptions can quietly steer growth strategy in the wrong direction.
Lenses for investigation
Personal relationships
If relationships are a competitive advantage in this industry, where is the organisation investing in them today, and does that align with what customers value?
01
Service failures
If getting the basics wrong drives customers away, how effectively does the organisation capture, measure, and learn from failures?
02
Sources of differentiation
What do customers genuinely value, and what do they simply expect as the baseline from any provider?
03
Strategic communication
Who should the organisation be talking to, when, and about what, to remain relevant beyond day-to-day operations?
04
Standardisation
As the industry moves towards greater standardisation, how consistent are processes across ports today?
05
Future expectations
As customers invest in sustainability and data, what capabilities will the organisation need to remain competitive in the future?
06
The findings revealed that some assumptions held true in parts of the system, while others overlooked important drivers of value. Together, they led us to reframe how the business understood performance and growth.
PROCESS & OUTCOMESFindings, Reframes & Outcomes
Value is created through a loop, not a single transaction: relationships generate recommendations → recommendations generate work → work generates revenue. Value creation, therefore, extends beyond formal financial flows into the relational networks that generate them.
Finding 01
Within the port ecosystem, work is shaped by two parallel systems: formal financial flows and informal influence. These do not align.
In contestable work, key decision-makers, particularly agents acting as the customer’s local proxy, sit outside the formal revenue structure, while local relationships remain highly influential in determining how work is awarded.
Reframing
→ Reframed how value is understood: Moved the client from a transactional view of “who pays us” to a systemic view of “how work is actually won,” separating financial flows from influence in the port ecosystem.
→ Identified a blind spot in investment: Highlighted that agents and local relationships—key drivers of recommendations and work allocation—sit outside formal revenue visibility, despite being critical to winning work
Outcome
How was this created?
30 qualitative interviews across the UK and Australian markets were synthesised into archetypes and a port ecosystem map that plotted money and influence side by side, making visible the roles that shape decisions without ever appearing on an invoice.
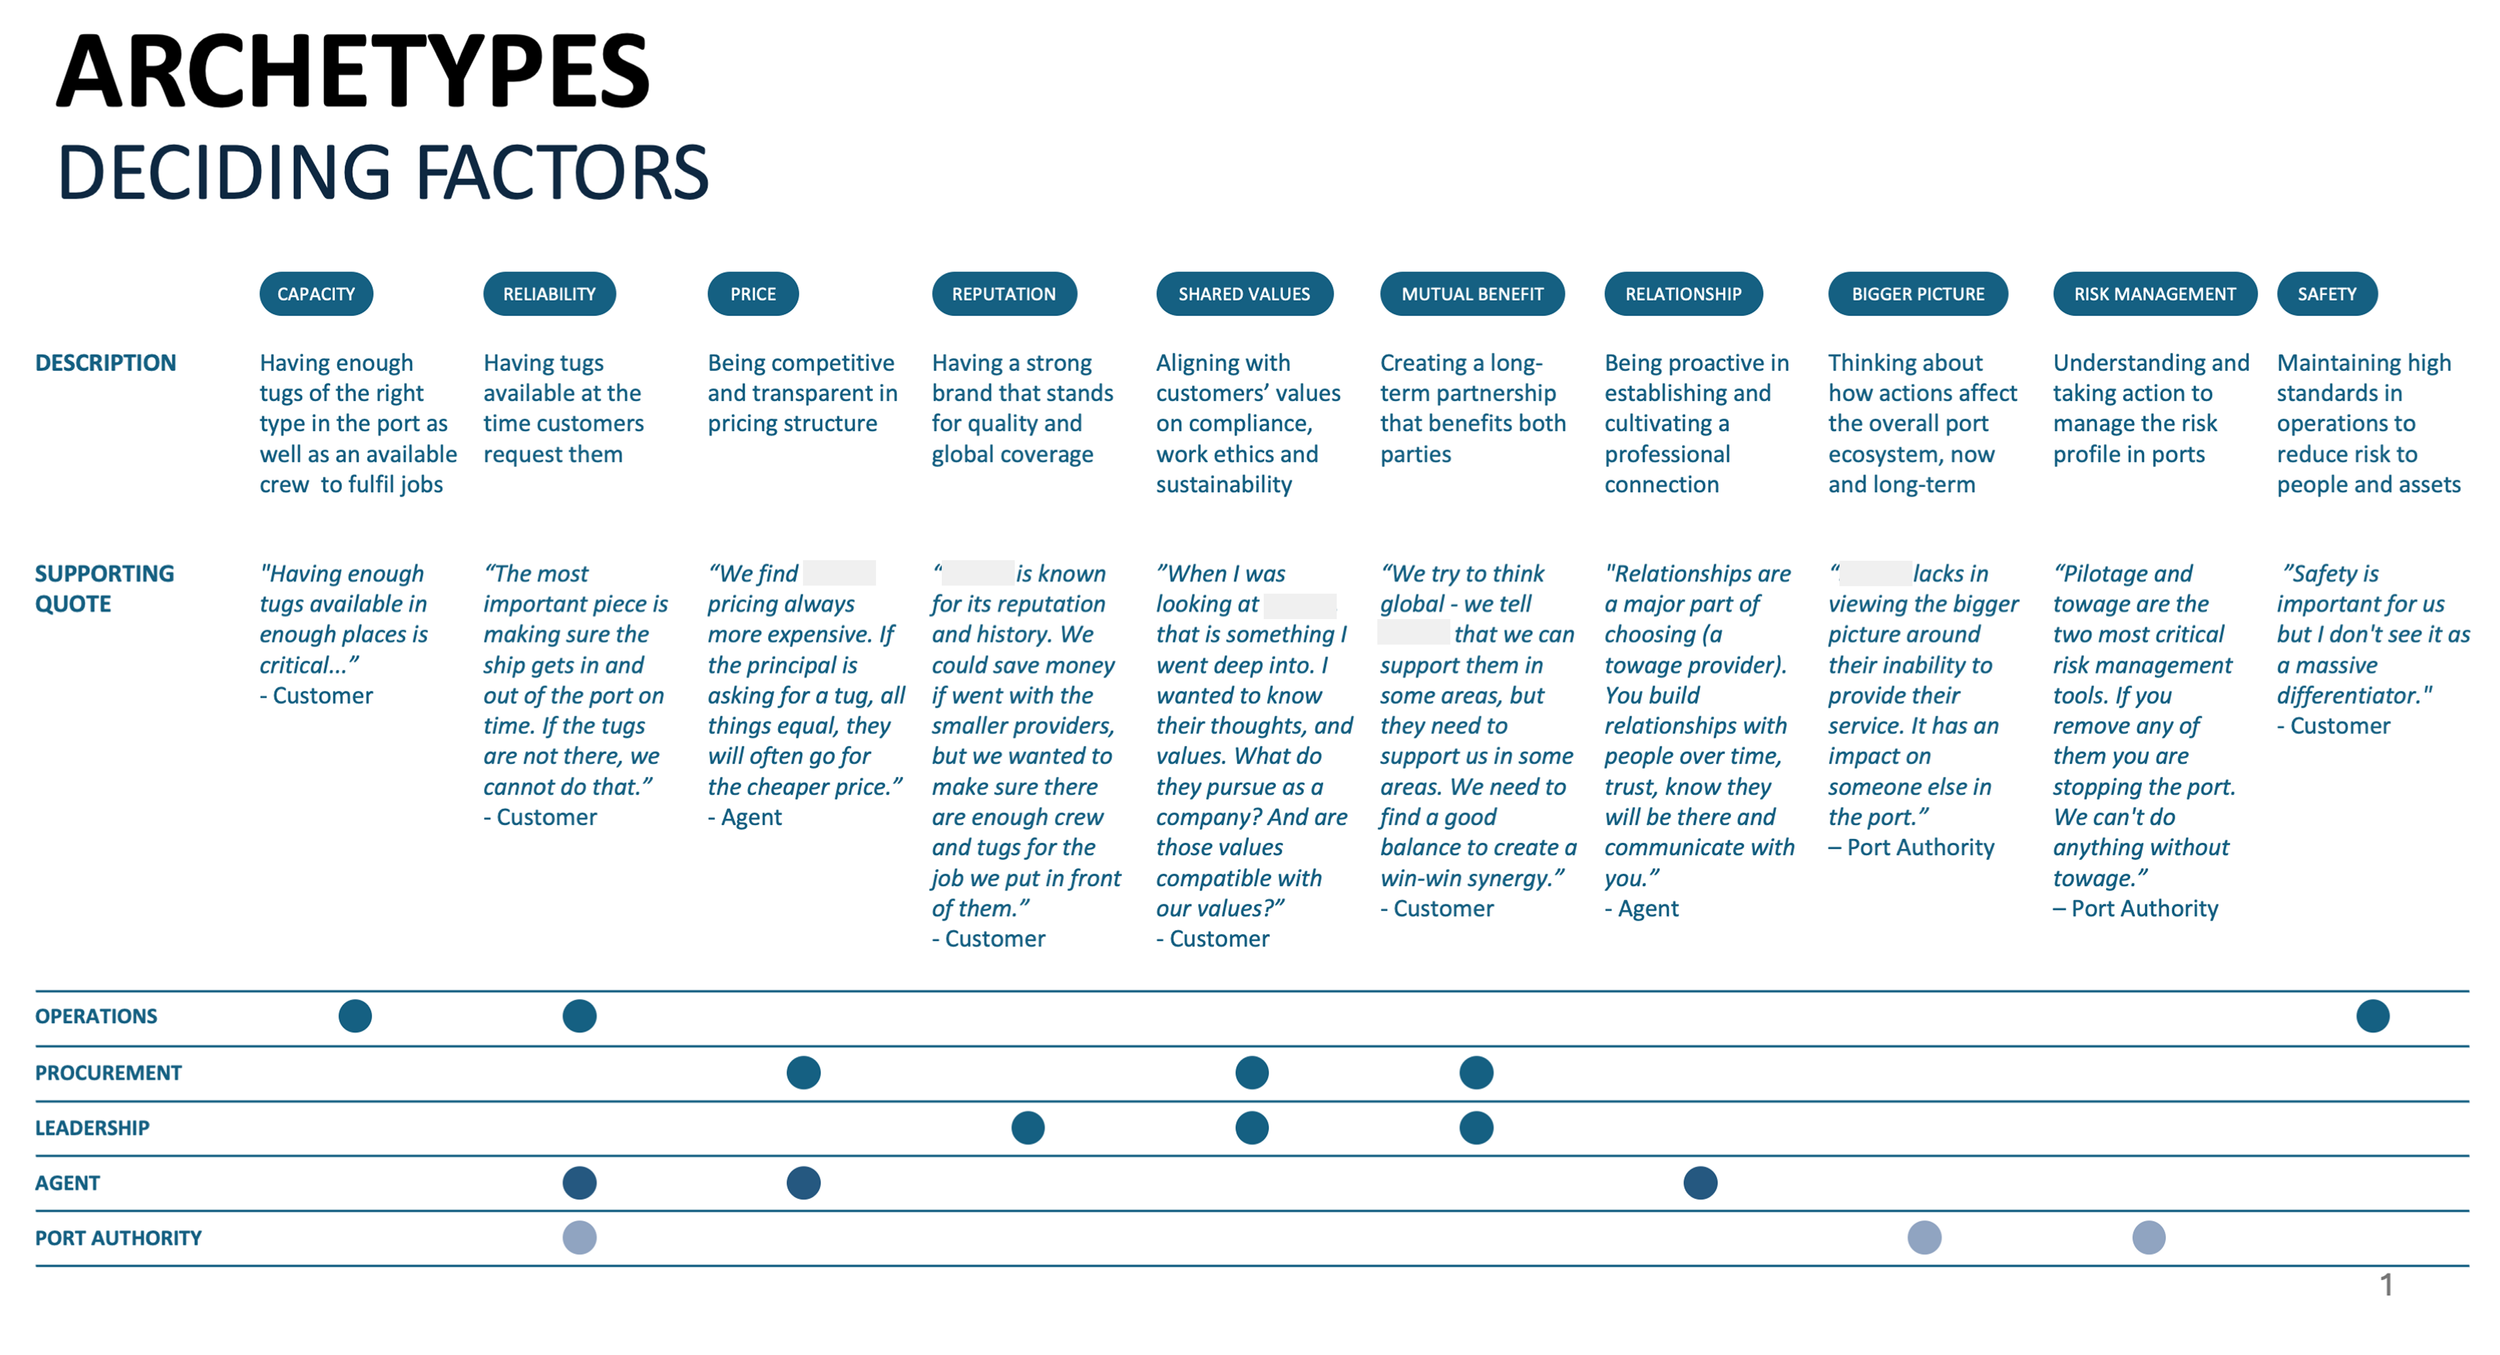
We synthesised and mapped the decision criteria that mattered to each archetype when selecting a towage provider. This helped the client understand which messages and value drivers to bring into conversations with different stakeholders.
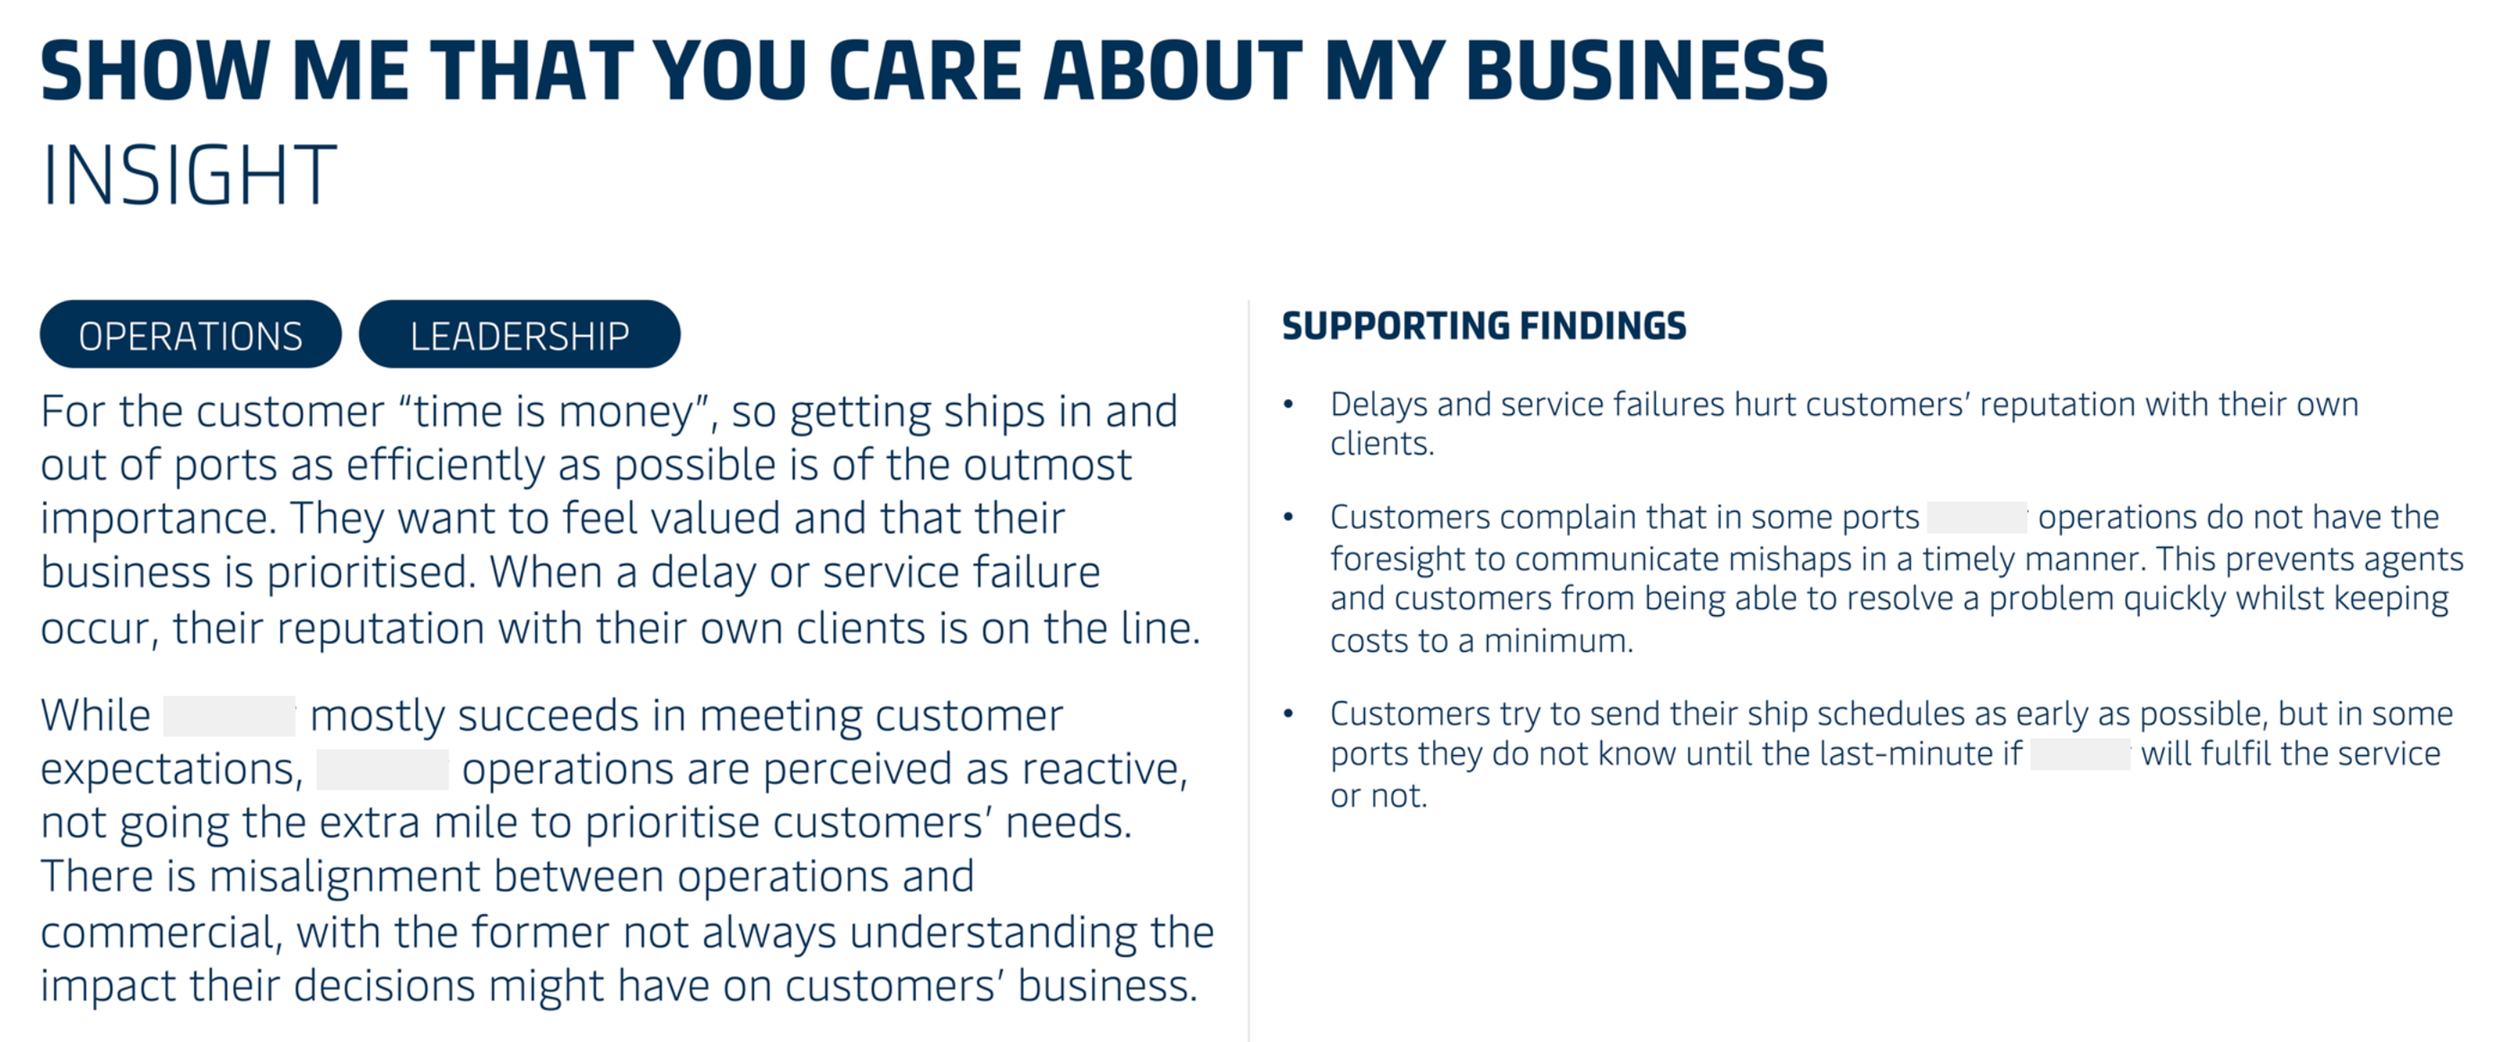
The business systems captured towage jobs that ran smoothly, but service breakdowns, delays, and customers turned away went unrecorded.
Finding 02
The data was missing exactly where it mattered most. The worst moments left no trace, so they could not be measured, improved, or evidenced to a customer, even though those were the moments that cost customers the most.
Reframing
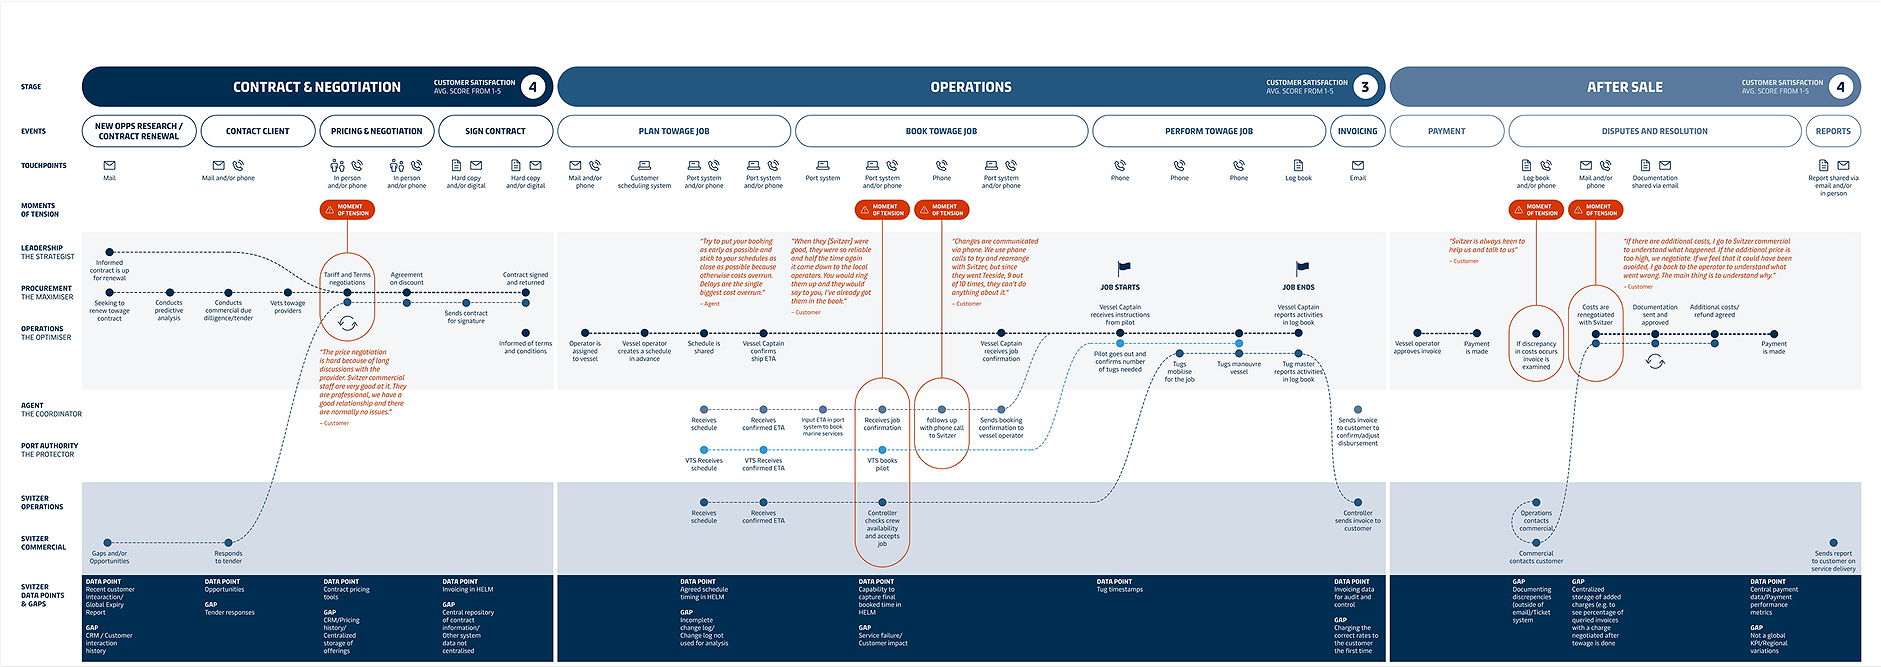
→ Located where the service goes unrecorded: Used a journey blueprint to map moments of service breakdown against the available data, illustrating that no corresponding records existed and creating a concrete case for capturing failures.
→ Defined a system mix: Recommended building service-failure capture into the existing operations system, turning an invisible gap into something trackable and accountable.
Outcome
How was this created?
We used qualitative interviews to map the towage lifecycle and reviewed quantitative data to understand what was being captured. We then layered the service experience over the client’s data points in a journey blueprint, making visible where failures occurred but went unrecorded.
Not all improvements create a competitive advantage. When baseline expectations are met across the market, value shifts to what sits beyond them: relationships, experience, shared value, and reputation.
Finding 03
The client interpreted “be more customer-focused” as a mandate to improve every aspect of the service, treating all upgrades as equally valuable.
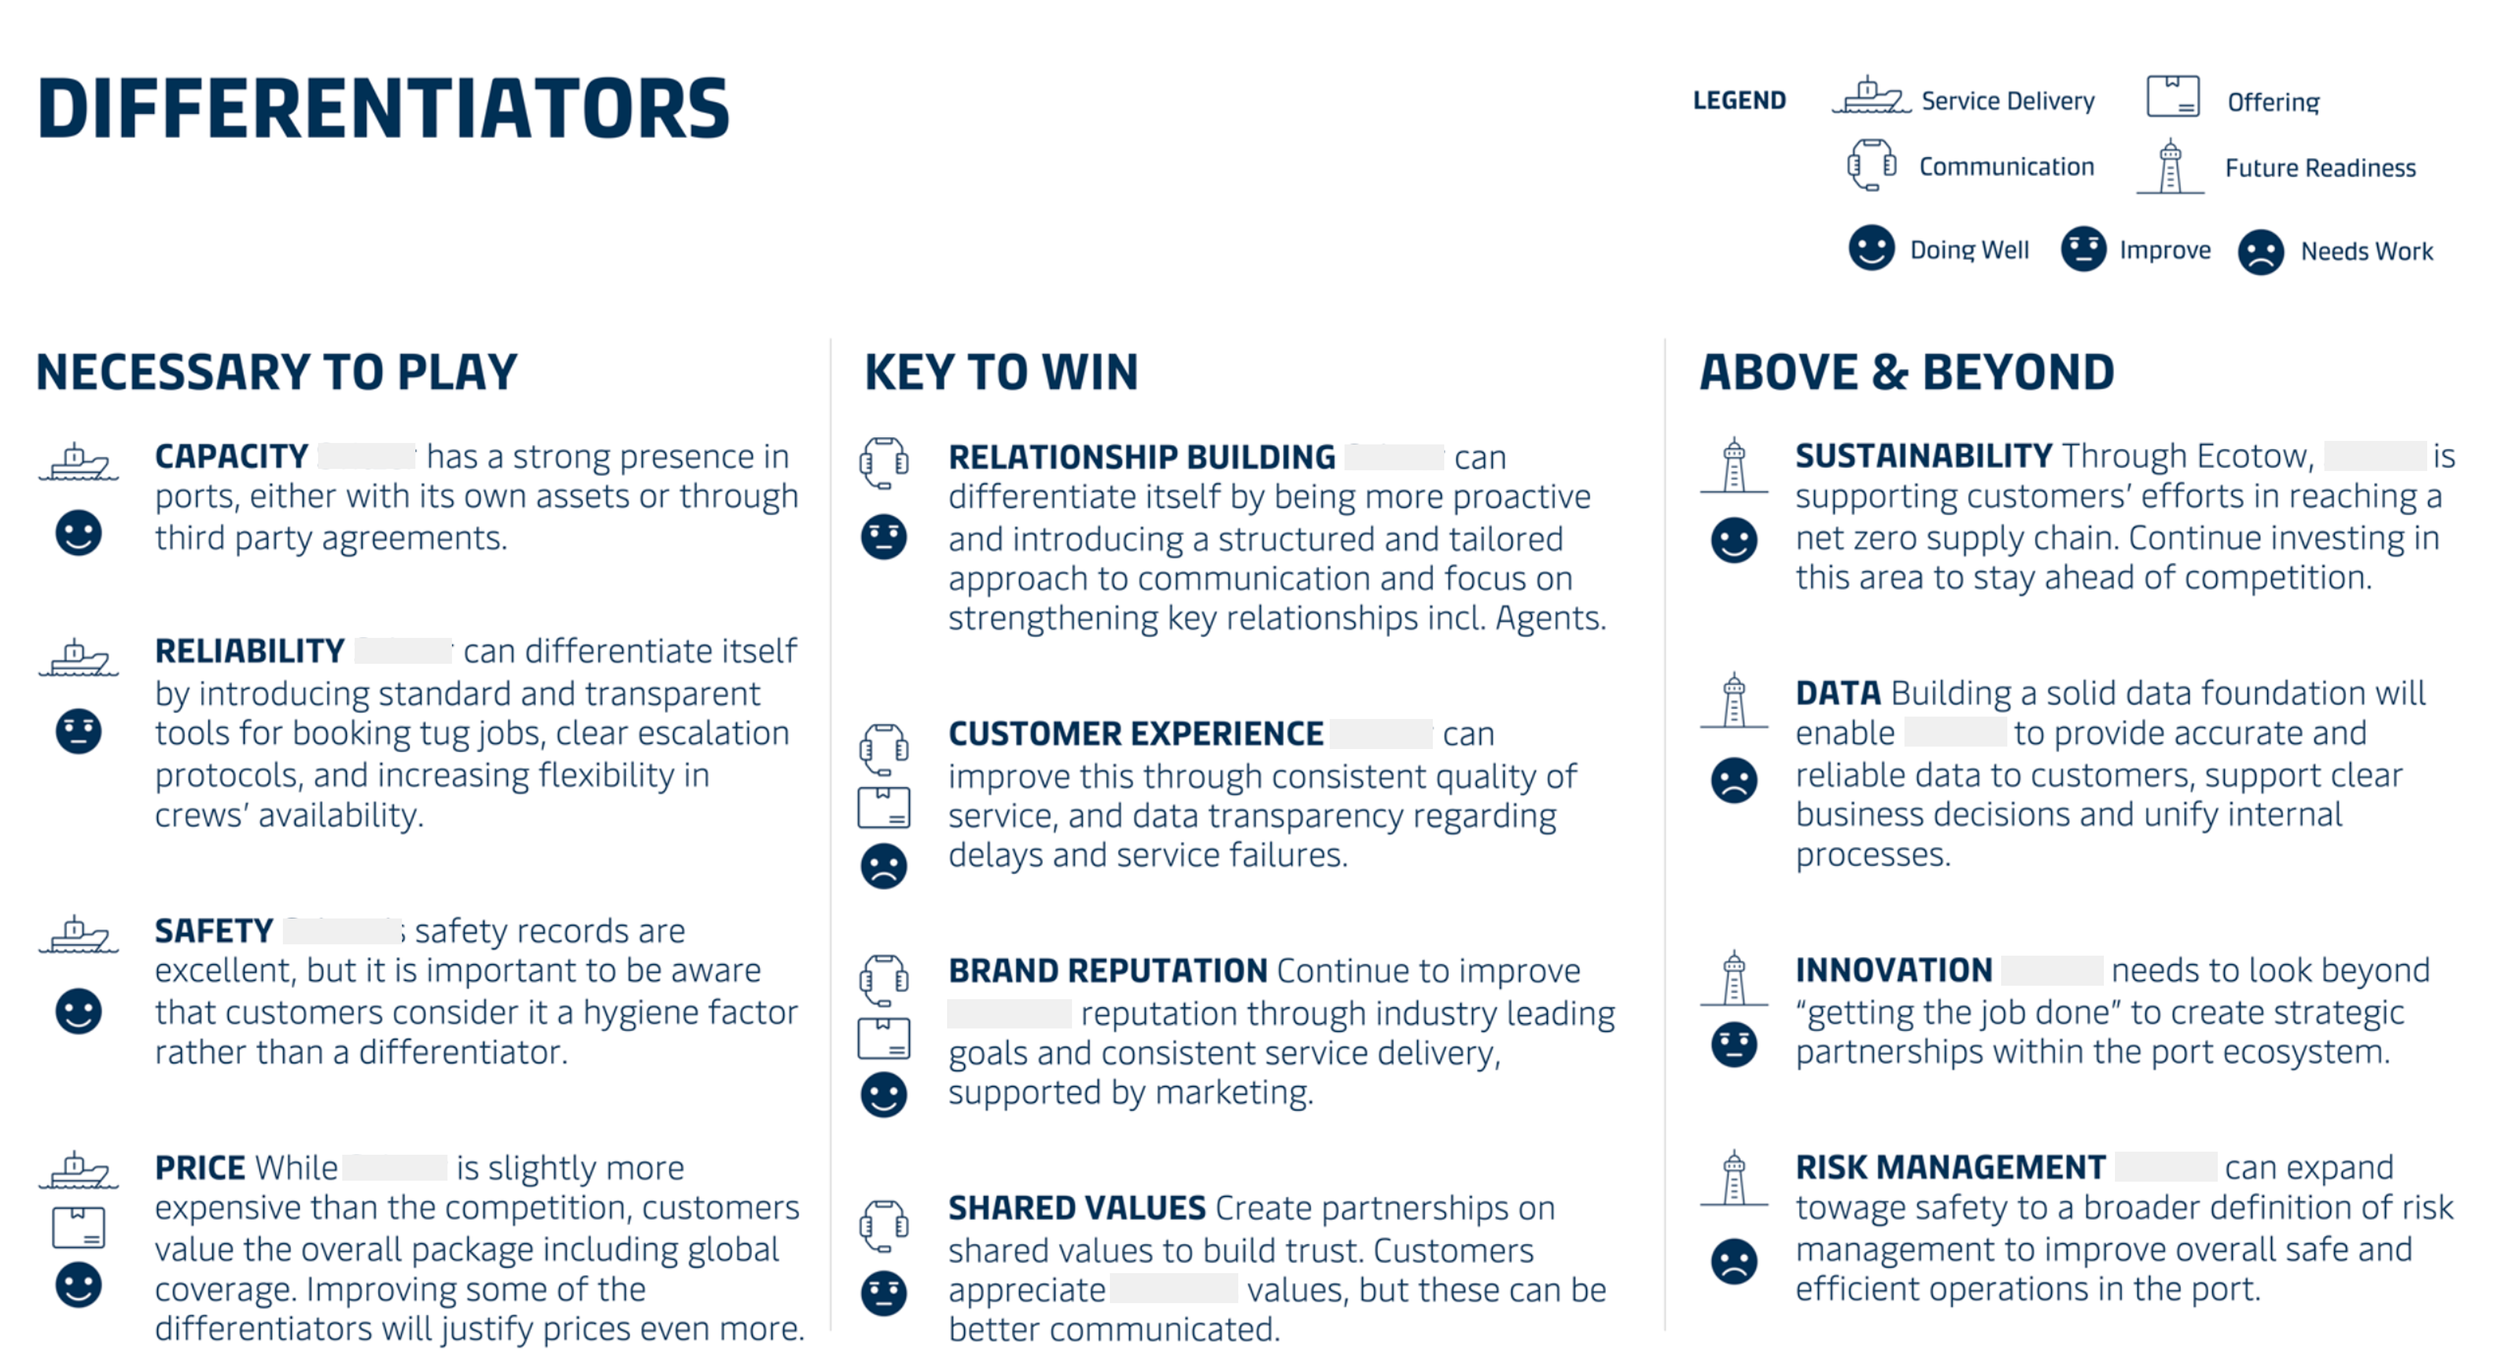
Customers saw it differently. Capacity, reliability, safety, and price were entry requirements: necessary to be shortlisted, but not reasons to win the work. Safety made the distinction clearest. It could not differentiate the offer, but failure could cost the business.
Reframing
→ Gave the client a clear view of customer value drivers in towage services: Synthesised research into what customers prioritise today and in the future, and how they evaluate and select providers, enabling more informed alignment of service development and investment decisions.
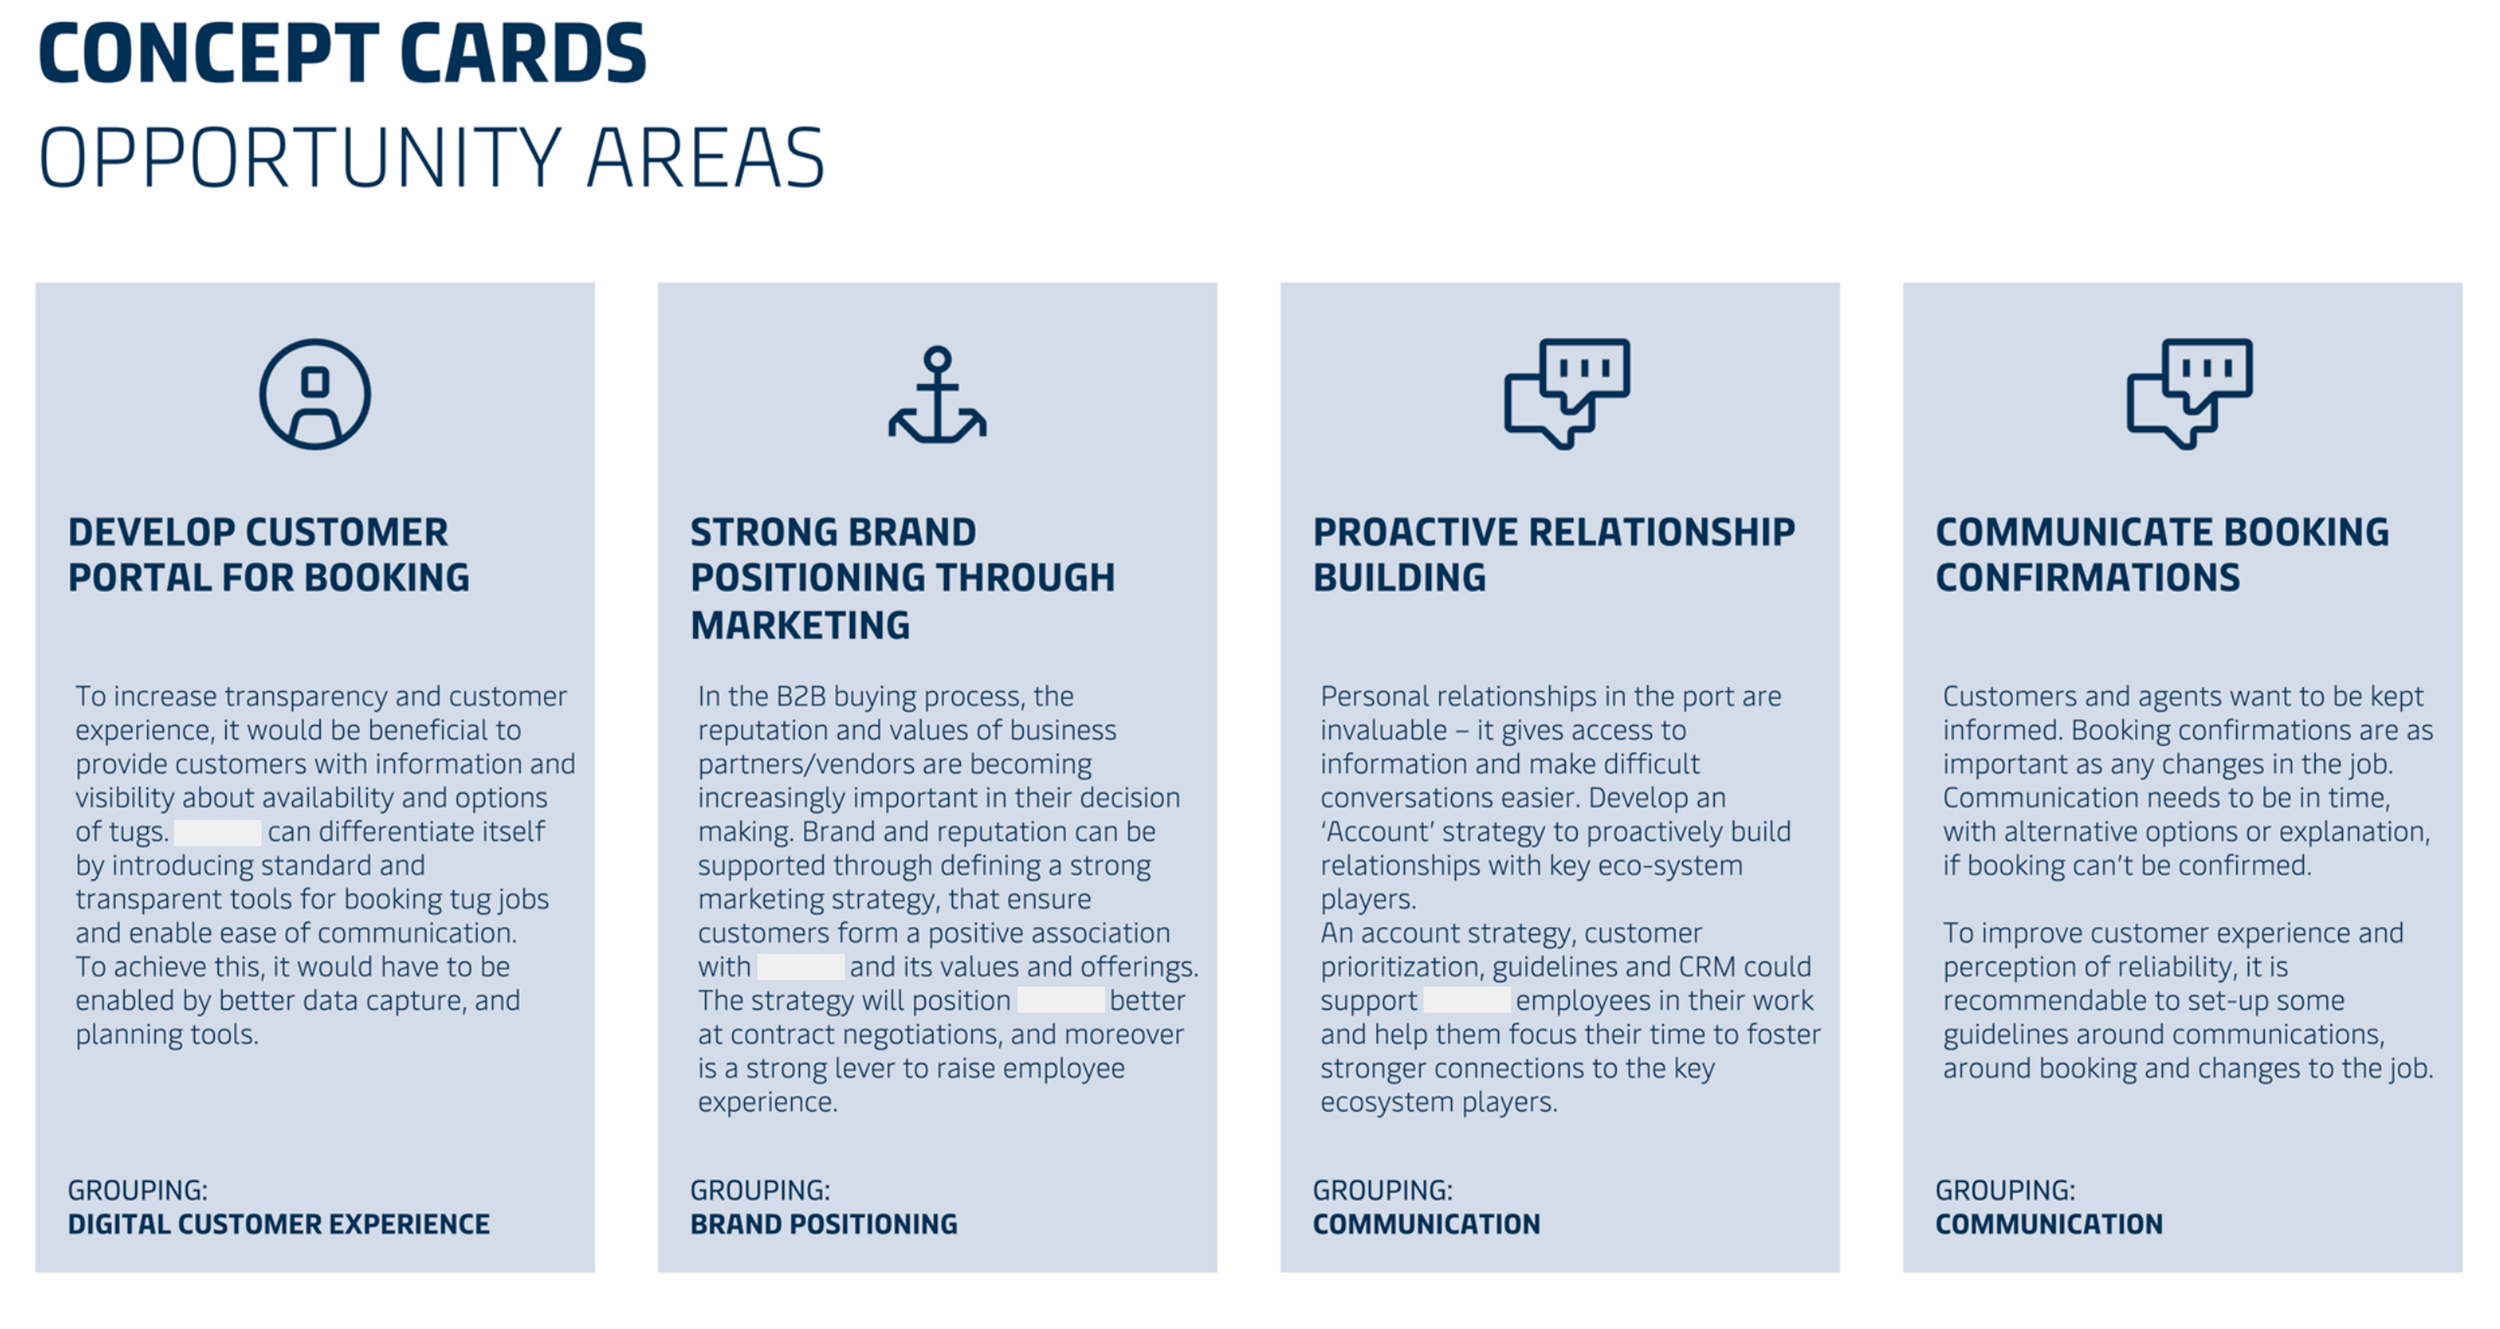
→ Created opportunities the client could act on: Turned the strategy into specific concept cards, concrete moves rather than a direction left to interpret.
→ Gave the client a clear basis for where to invest first: Grouped opportunities into:
What keeps them in the game
What wins the work
What could be staged for later
Then mapped them by value and time so the investment could follow the impact rather than be spread evenly.
Outcome
How was this created?
We conducted remote qualitative interviews with 30 customers across segments and geographies to understand what they valued. The findings were used to benchmark the client’s offering against customer priorities and organise opportunities into three tiers. Through workshops and customer-sorting exercises, we translated these priorities into concept cards for further exploration and investment discussions.
CARRYING IT FORWARDSequence the bets by risk
We then selected the concept cards that the client was prioritising for investment and translated them into testable assumptions. For each assumption, we defined experiments to assess whether the idea created value in practice.
Rather than treating the concepts as fixed solutions, the goal was to establish a structured learning process that used evidence to refine, adapt, or redirect future investment decisions.
Assumption Tested
That investing in relationships leads to increased recommendations and work
First Test
Track a small set of live opportunities. Increase proactive engagement with key agents through regular check-ins, early information-sharing, and requests for input. Observe whether this changes when and how the client becomes involved.
Signals/ Observable Metrics
Agents respond more readily and initiate follow-up without prompting (inbound versus outbound contacts, follow-up frequency)
Agents share opportunities, customer context, or decision criteria earlier (more qualified opportunities)
Agents introduce the client to decision-makers or invite them into pre-tender conversations (increased invitations at the earlier stage of 1st involvement)
Agents explicitly recommend or advocate for the client (win-rate, repeat allocations, revenue generation)
Assumption Tested
That improving booking and confirmation flows reduces uncertainty at critical service moments
First Test
Prototype the booking and confirmation flow and introduce it into a small set of real customer interactions, particularly during previously identified waiting and disruption periods.
Signals/ Observable Metrics
Fewer calls or emails asking whether the towage booking is confirmed
Fewer status-chasing requests during waiting or disruption periods
Fewer escalations caused by uncertainty about timing, availability, or next steps
Less manual clarification required from operations teams
Confirmation information is accepted without additional follow-up
Assumption Tested
Brand messaging influences decision-making in a reliability-driven market.
First Test
Test different positioning framings (reliability-led, relationship-led, brand-led) across existing customer touchpoints, such as proposals, emails, and conversations already happening in live processes.
Signals/ Observable Metrics
Higher response or engagement rates under particular messaging frames
Decision-makers or agents responding more positively to specific value messages
Customers repeating or referring back to particular messages without prompting
Stronger recall of the company and its value proposition after the interaction
The work was handed over with a validation approach designed to support that learning process beyond the project's duration. At the point of delivery, implementation and testing had not yet been executed, leaving the next phase open for the client to run and learn from.